Additional Reports from Bookings Download Report Excel
There are several additional reports available as separate tabs when downloading a booking report from Search Bookings.
For more details about how to download booking reports, see Search Booking Page Downloads.
This page explains the content of each tab in the downloaded Excel file.
RoomBoss
Shows all bookings, packages, and items along with the fields you selected when downloading the booking report.
For more information on configuring which fields appear, see Search Booking Page Downloads.
Summary
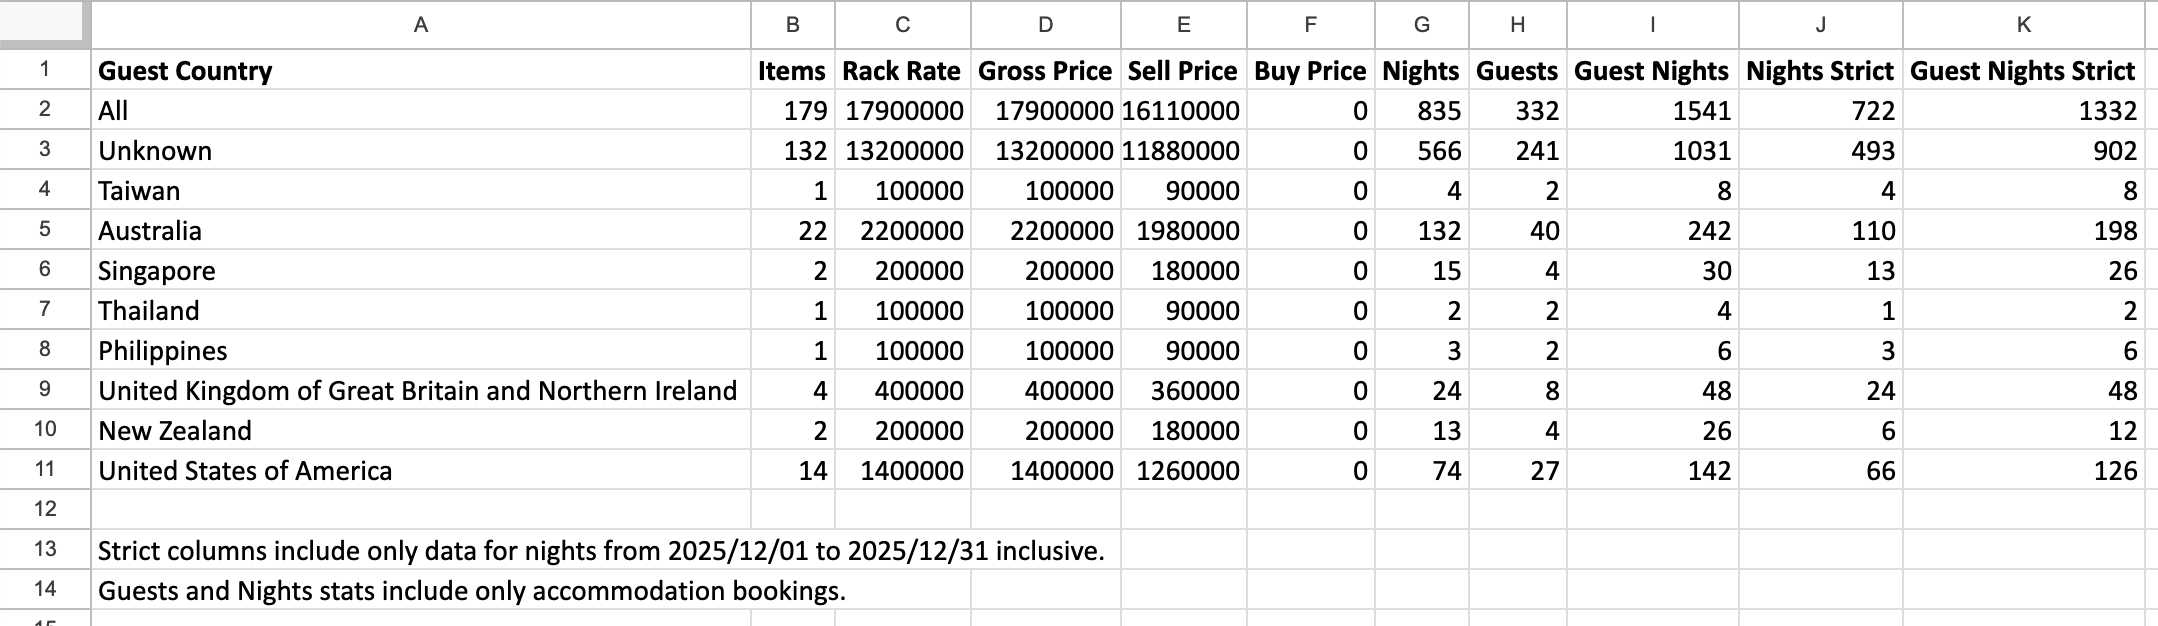
Shows where your guests come from and how much each market contributes to your bookings and revenue.
Lists each guest country with key metrics such as number of bookings, nights, guests, and total revenue.
The “Strict” columns display results only for stays within the defined date range.
Use this report to identify top-performing markets, understand average spend per guest or night, and focus marketing efforts on your most valuable regions.
When Booked
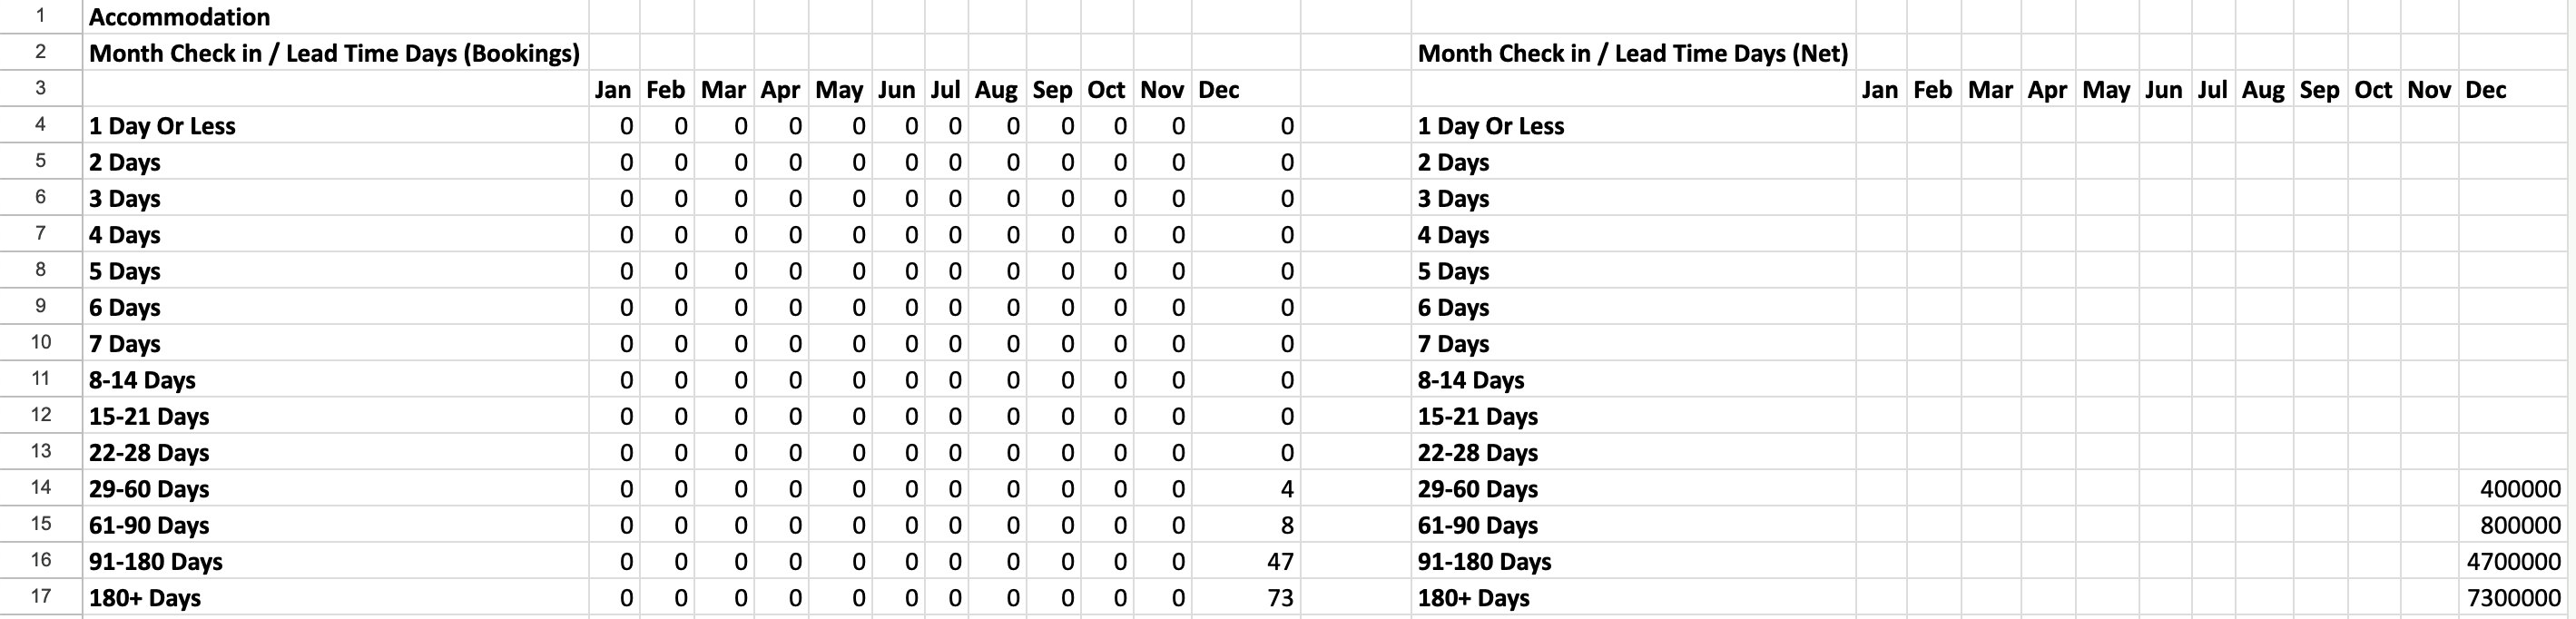
Shows how far in advance guests book their stays and when those bookings were made relative to their check-in month.
Check-in vs Lead Time (Bookings & Net Value)
- Displays bookings grouped by the number of days between booking date and check-in date (“lead time”).
- For each check-in month, you can see:
- Number of bookings by lead time category (e.g. 1–7 days, 29–60 days, 180+ days)
- Net value of those bookings
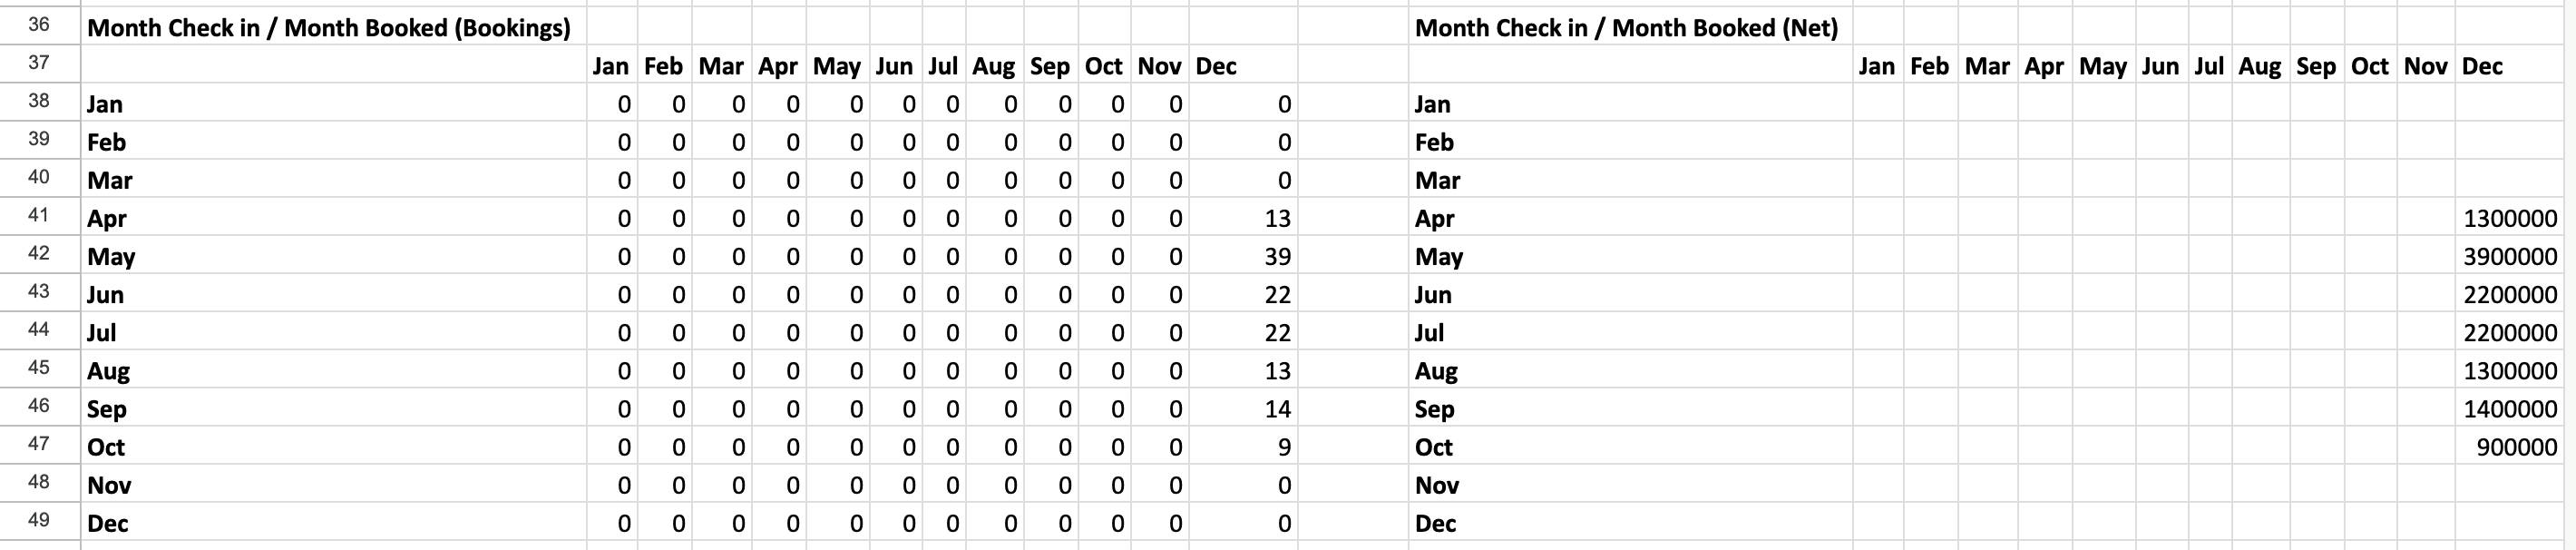
Check-in Month vs Booking Month
- Shows when bookings were made relative to the month of check-in.
- Each row represents the check-in month, and each column represents the month the booking was made.
Meals
Shows daily counts of included meals (Breakfast, Lunch, Dinner) for each date, vendor, and booking.
Use this report to plan kitchen production, staffing, and guest meal management.

ADR.RevPar.Occupancy
Shows key occupancy and revenue performance metrics for each vendor, room type, and individual room during the selected date range.
Includes:
- Sellable, Sold, and OOO/OOS Nights — total available vs. sold nights per room or type
- Occupancy & Sold Occupancy % — how efficiently rooms were sold
- ADR (Average Daily Rate) and RevPAR (Revenue per Available Room) — main profitability measures
- Gross and Adjusted Gross — total revenue, with adjusted figures estimating potential earnings if all zero-value nights were sold

OutOfOrder.Service
Shows all Out of Service (OOS) or Out of Order (OOO) rooms during the selected period.
Useful for tracking unavailable inventory and understanding its impact on occupancy calculations.
Accommodation Tax / Bed Tax
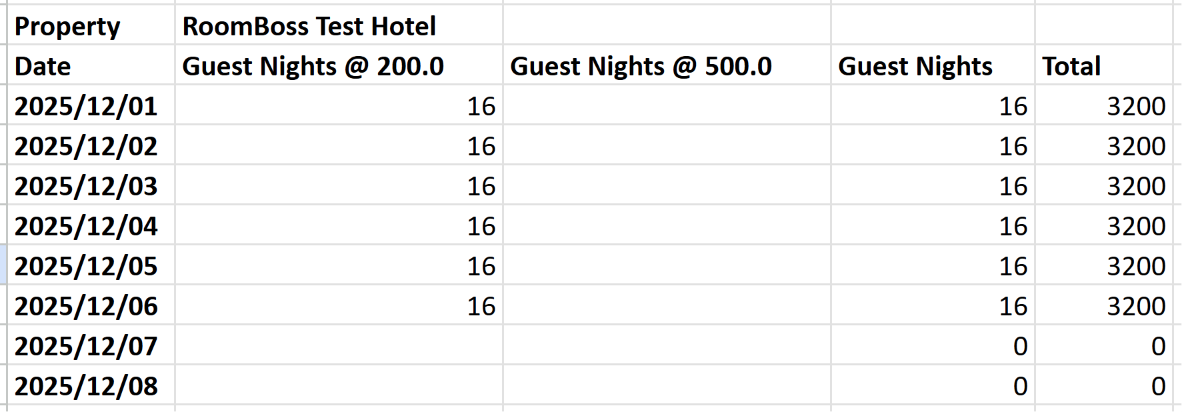
Displays a daily breakdown of guest nights by accommodation tax rate, along with the total tax amount for each day.
The report includes:
- Date – The stay date.
- Guest Nights @ Rate – The number of guest nights that fall into each accommodation tax band (for example, ¥200 or ¥500).
- Guest Nights – The total guest nights for that date.
- Total – The total accommodation tax amount calculated for that date.
This report is only included when the selected vendor or room type has a banded Accommodation Tax Price Component configured.
In this case, the downloaded Custom Report Excel file will inclde an additional tab named Banded Tax.